Grafana Status Page - MessMass
This project was carried out during my final-year internship with the MessMass team at Michelin. The core issue was clear: other IT teams had very little visibility on the actual state of our middleware and often opened tickets without knowing whether the problem came from their applications… or from us.
I designed and implemented a status page in Grafana to monitor critical middleware in real time, visualize incident history, and give consuming teams an immediate answer to a simple question: “Is this incident coming from MessMass infrastructure or from my own perimeter?”
Context and objectives
As part of the OneSystem IT Platforms program, the MessMass team needed to improve middleware observability (EDA, MFT, EAI, IFE/M2I, ETL) and reduce “unnecessary” tickets. The status page had to:
- provide a synthetic and reliable view of service states to other IT teams;
- help quickly identify whether an incident originates from middleware or from consumers;
- centralize status, incident history and service quality indicators in one place;
- integrate smoothly with the existing ecosystem (Grafana, Prometheus, ServiceNow).
My role
When I joined, Grafana had just been introduced at Michelin. I had to learn the tool mostly on my own and gradually build a complete, maintainable status page that would act as a reference implementation for future Grafana work within the company.
- Designed the overall structure of the page (domains, services, indicators, navigation).
- Configured metrics in Prometheus and integrated several exporters (Blackbox, OpenTelemetry, custom scripts).
- Created Grafana panels (Canvas, tables, cards, combined indicators) and PromQL queries.
- Collaborated with another apprentice to integrate API team data into the status page.
- Wrote user and technical documentation, along with a graphical standardization guide.
Key features
- Real-time monitoring of around fifteen internal and external middleware services via Prometheus and various exporters (Blackbox, OpenTelemetry, Python scripts).
- Clear, standardized visual indicators (OK/KO/Maintenance, colors, icons) for quick reading.
- Incident history with direct links to ServiceNow tickets and SharePoint tracking pages.
- Display of SLI metrics and SLO burn rate to compare performance against objectives.
- Drill-down feature showing detailed lists of components and nodes for each middleware.
- Organization by functional domain (EDA, MFT, EAI, IFE/M2I, ETL) reflecting actual business usage.
- Integration of an internal API to aggregate additional data from other squads.
Architecture and implementation
The status page is built on a unified observability architecture:
- Prometheus collects metrics (availability, errors, queue size, response times) using the Blackbox Exporter, OpenTelemetry collectors, Python scripts and K6 tests.
- A REST service exposes consolidated data in JSON format for specific scopes.
- Grafana queries these sources and displays results in customized panels (Canvas, tables, cards, combined views).
Across iterations, the dashboard evolved from a simple binary up/down view into a structured, domain-based page combining current status, incident history and service indicators in a single interface designed for real-world users.
Project evolution and impact
Development went through several stages: a first PoC based on Blackbox, the introduction of richer statuses, domain-based organization and enrichment with other teams’ data. The final version, validated by the HIP squad, became a reference status page for future Grafana usage at Michelin.
Although my internship ended right as the solution was entering production, the intended impact is clear: fewer unnecessary tickets, better understanding of middleware health by consuming teams, and easier diagnostics thanks to a single, consolidated view of the most important information.
Version illustrations
To better visualize the status page evolution through iterations, here are some representative screenshots of the different dashboard versions.
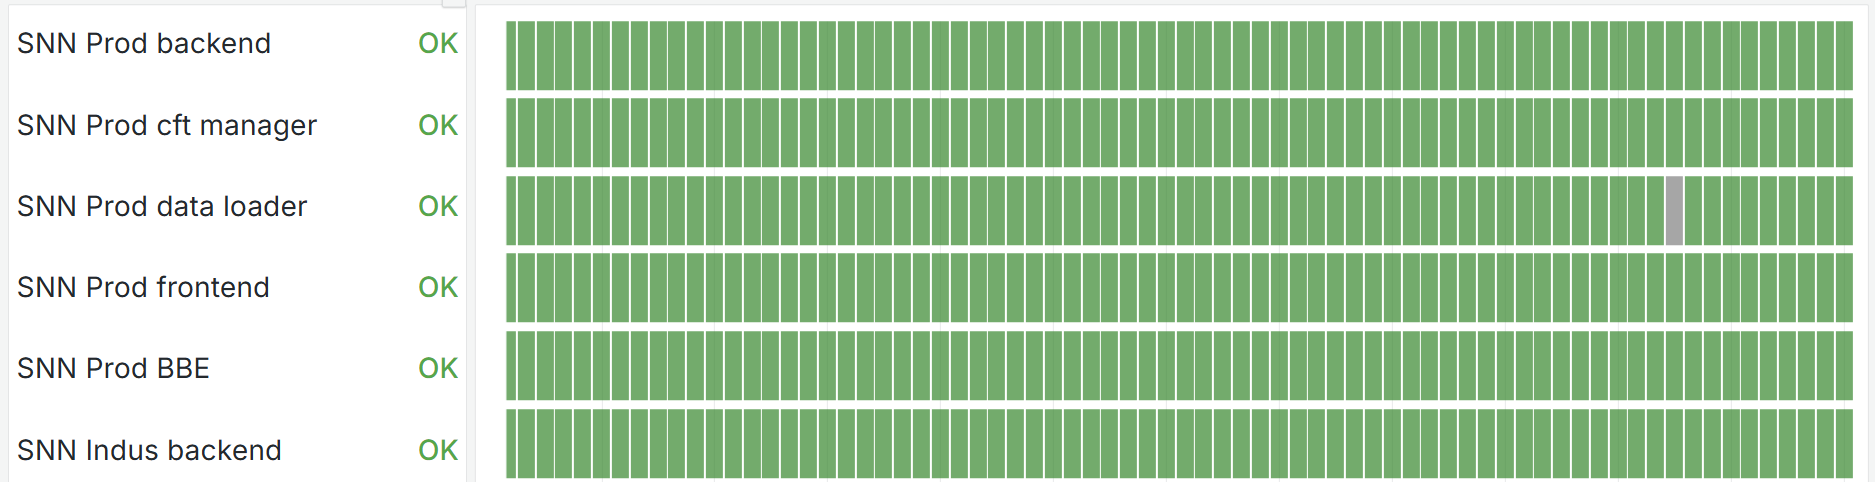
PoC Version
First proof of concept limited to availability verification via the
Blackbox Exporter. Statuses are binary (up/down) and the interface very clean.
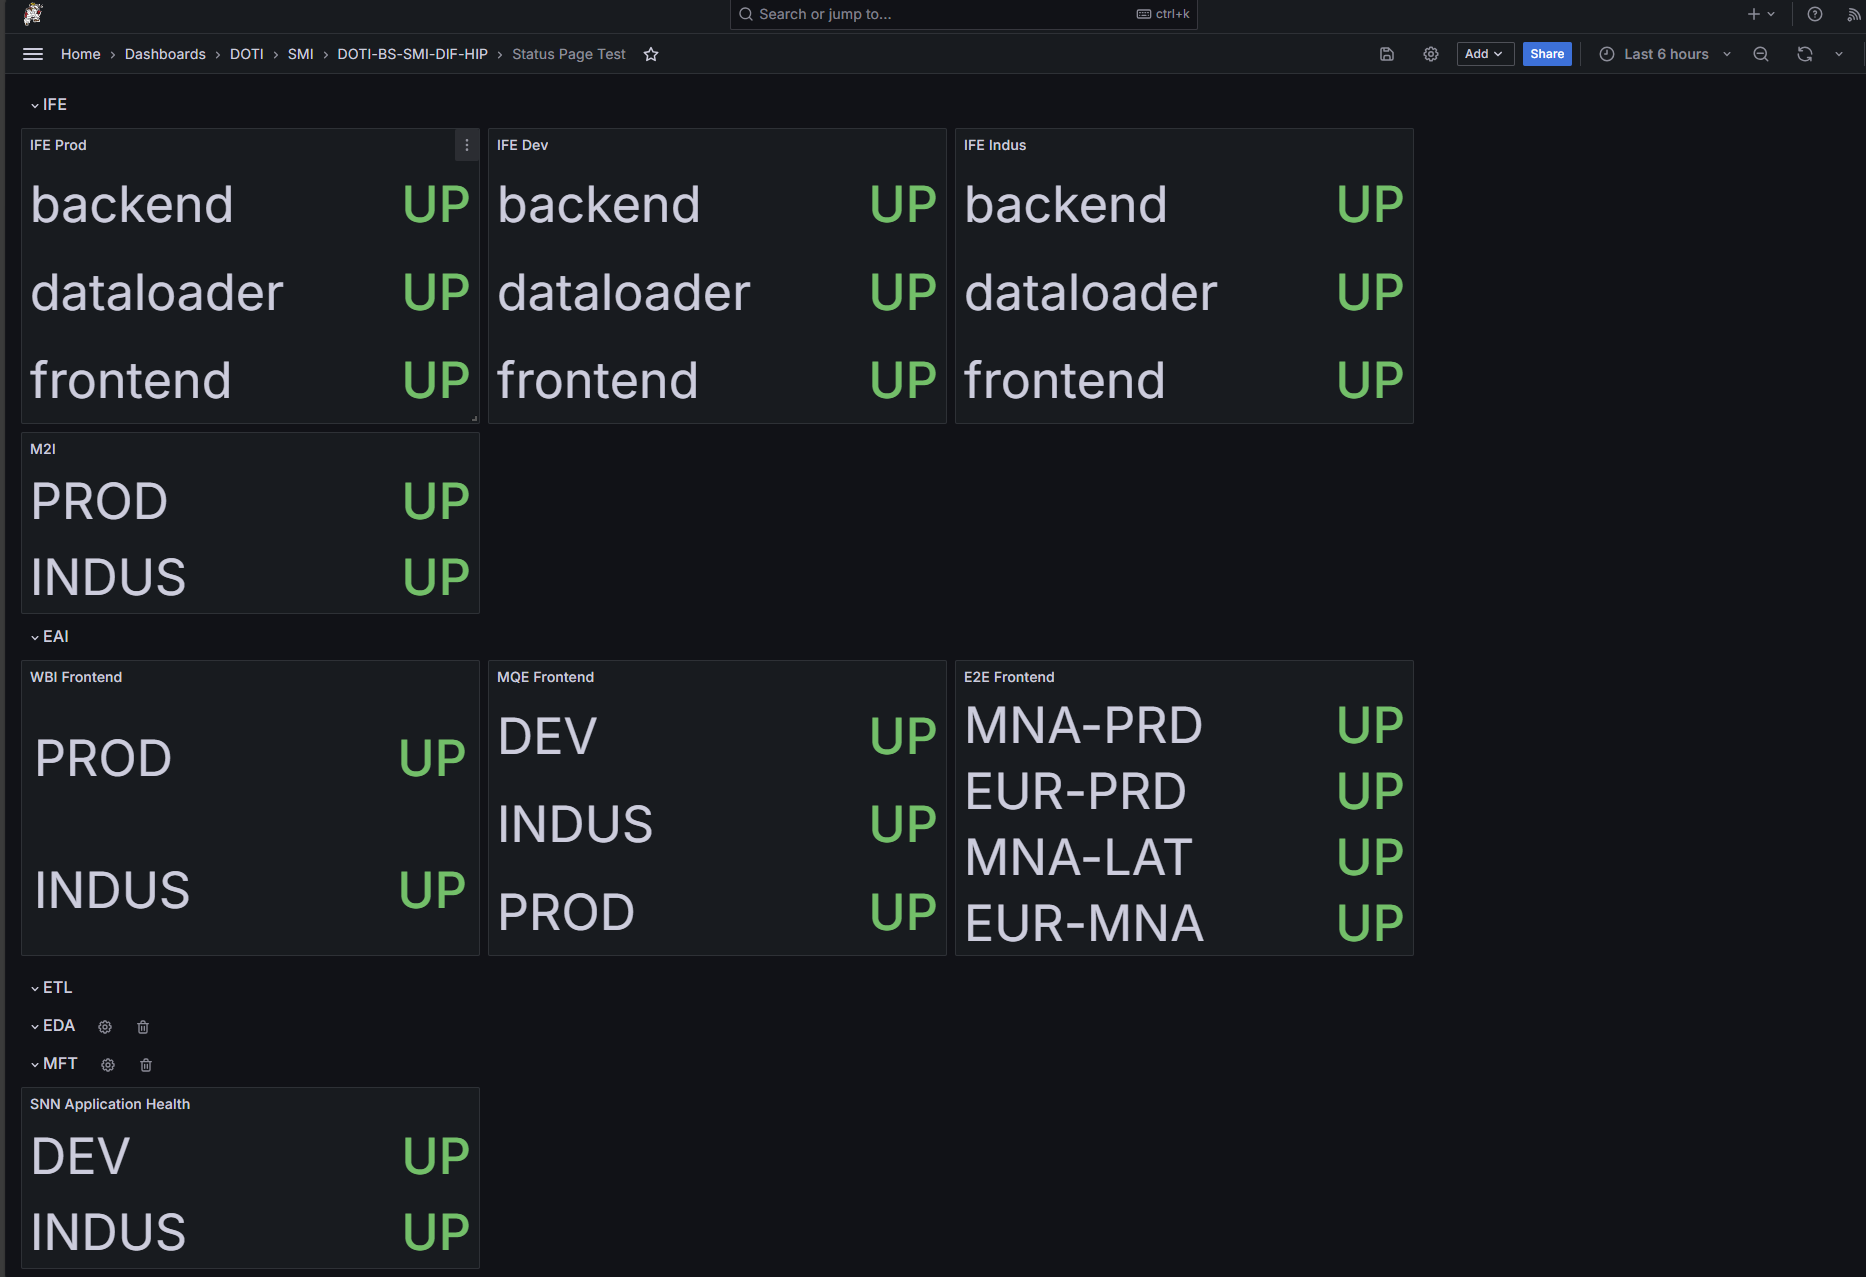
First version
Introduction of dynamic cards for each environment (Prod, Dev, Indus).
Visual structure starts to align with how teams actually work.
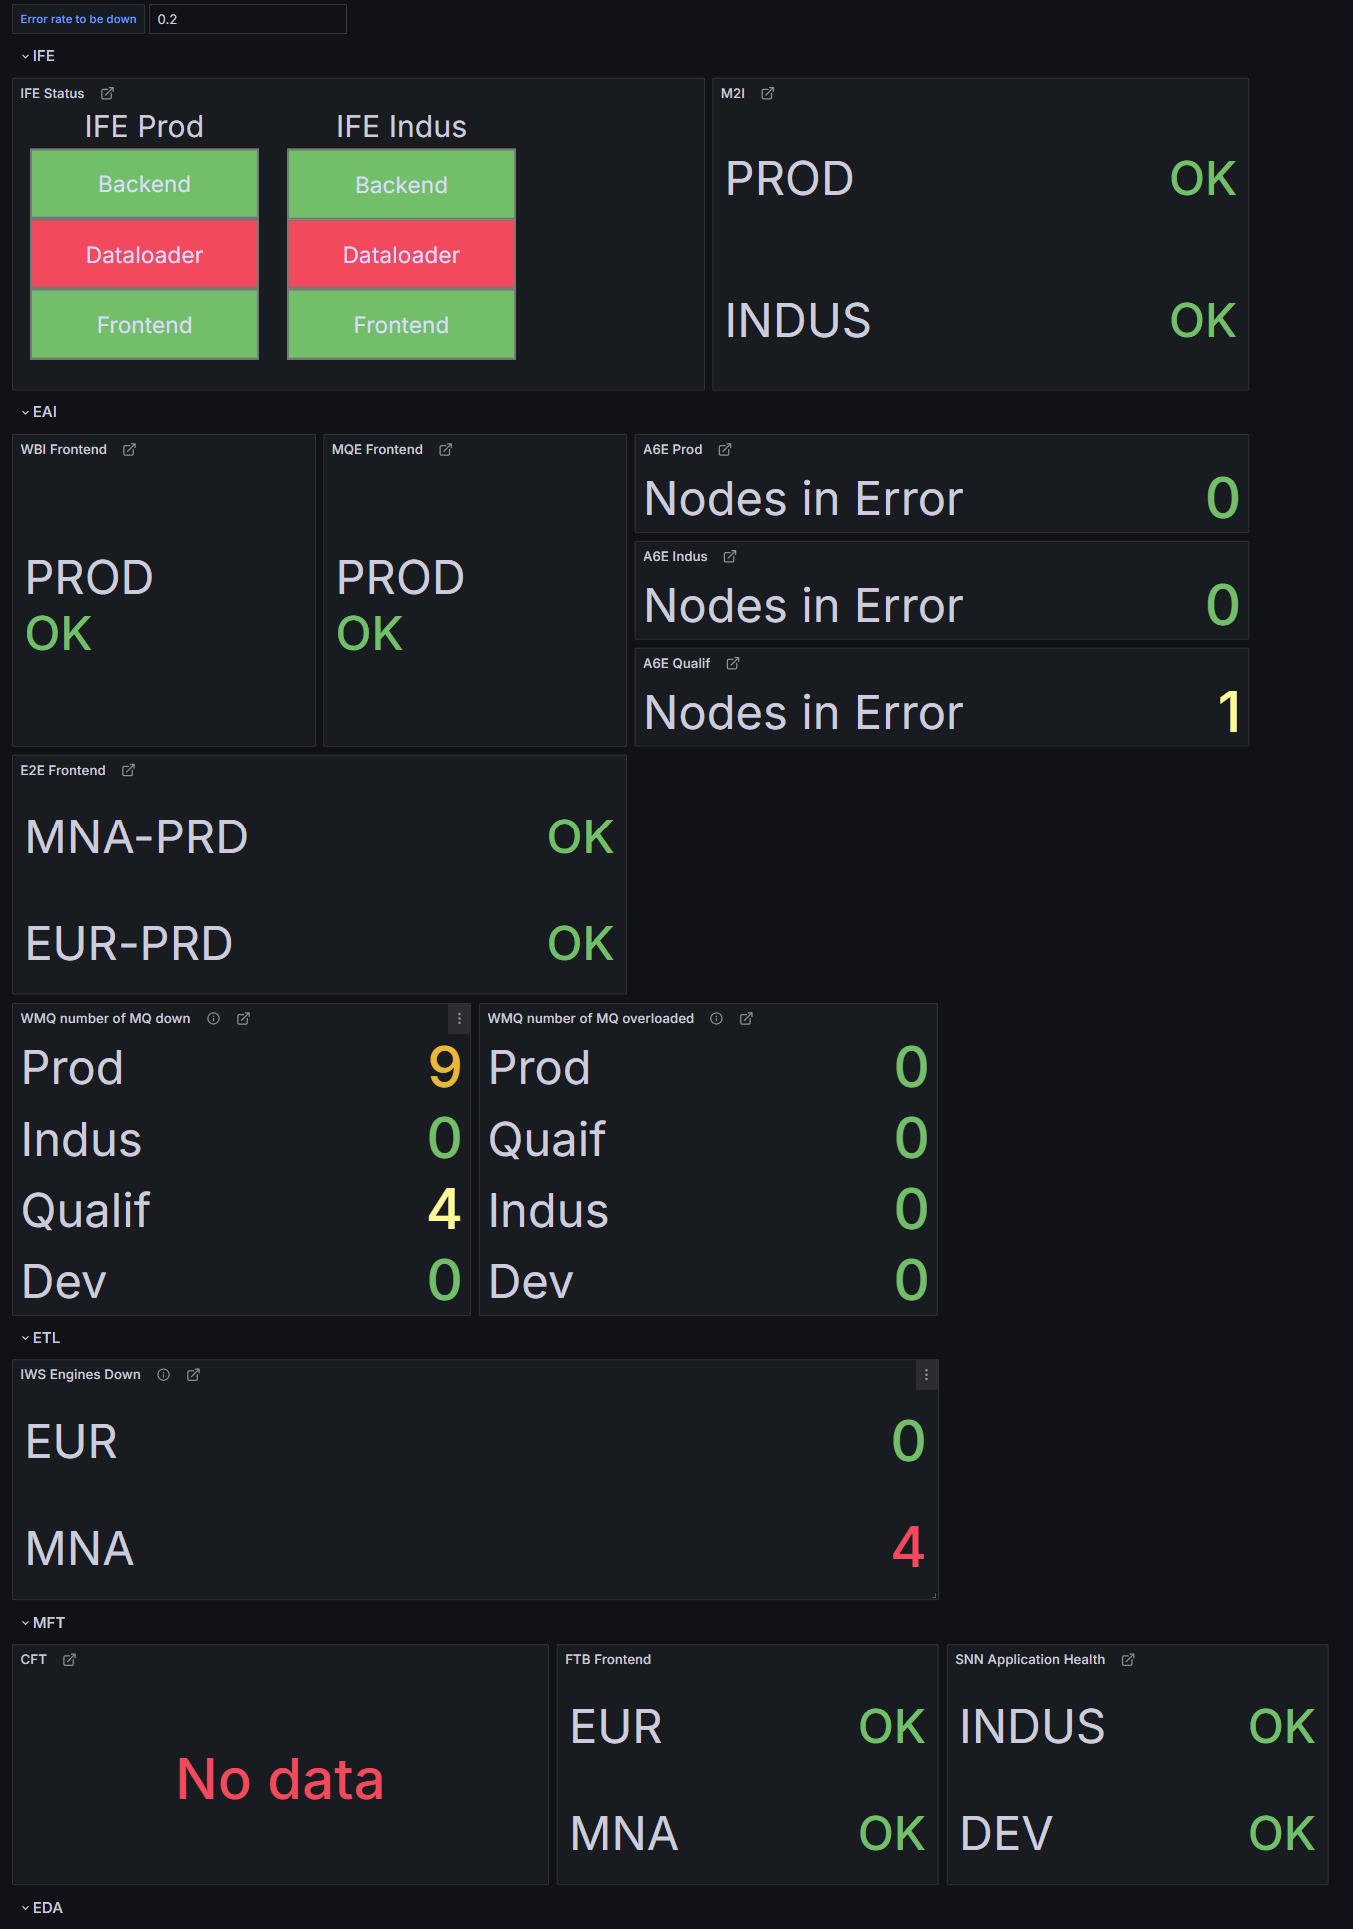
Test version
Experimentation with thresholds and color codes. Sections are
reorganized and new indicators appear (number of nodes in error,
etc.).
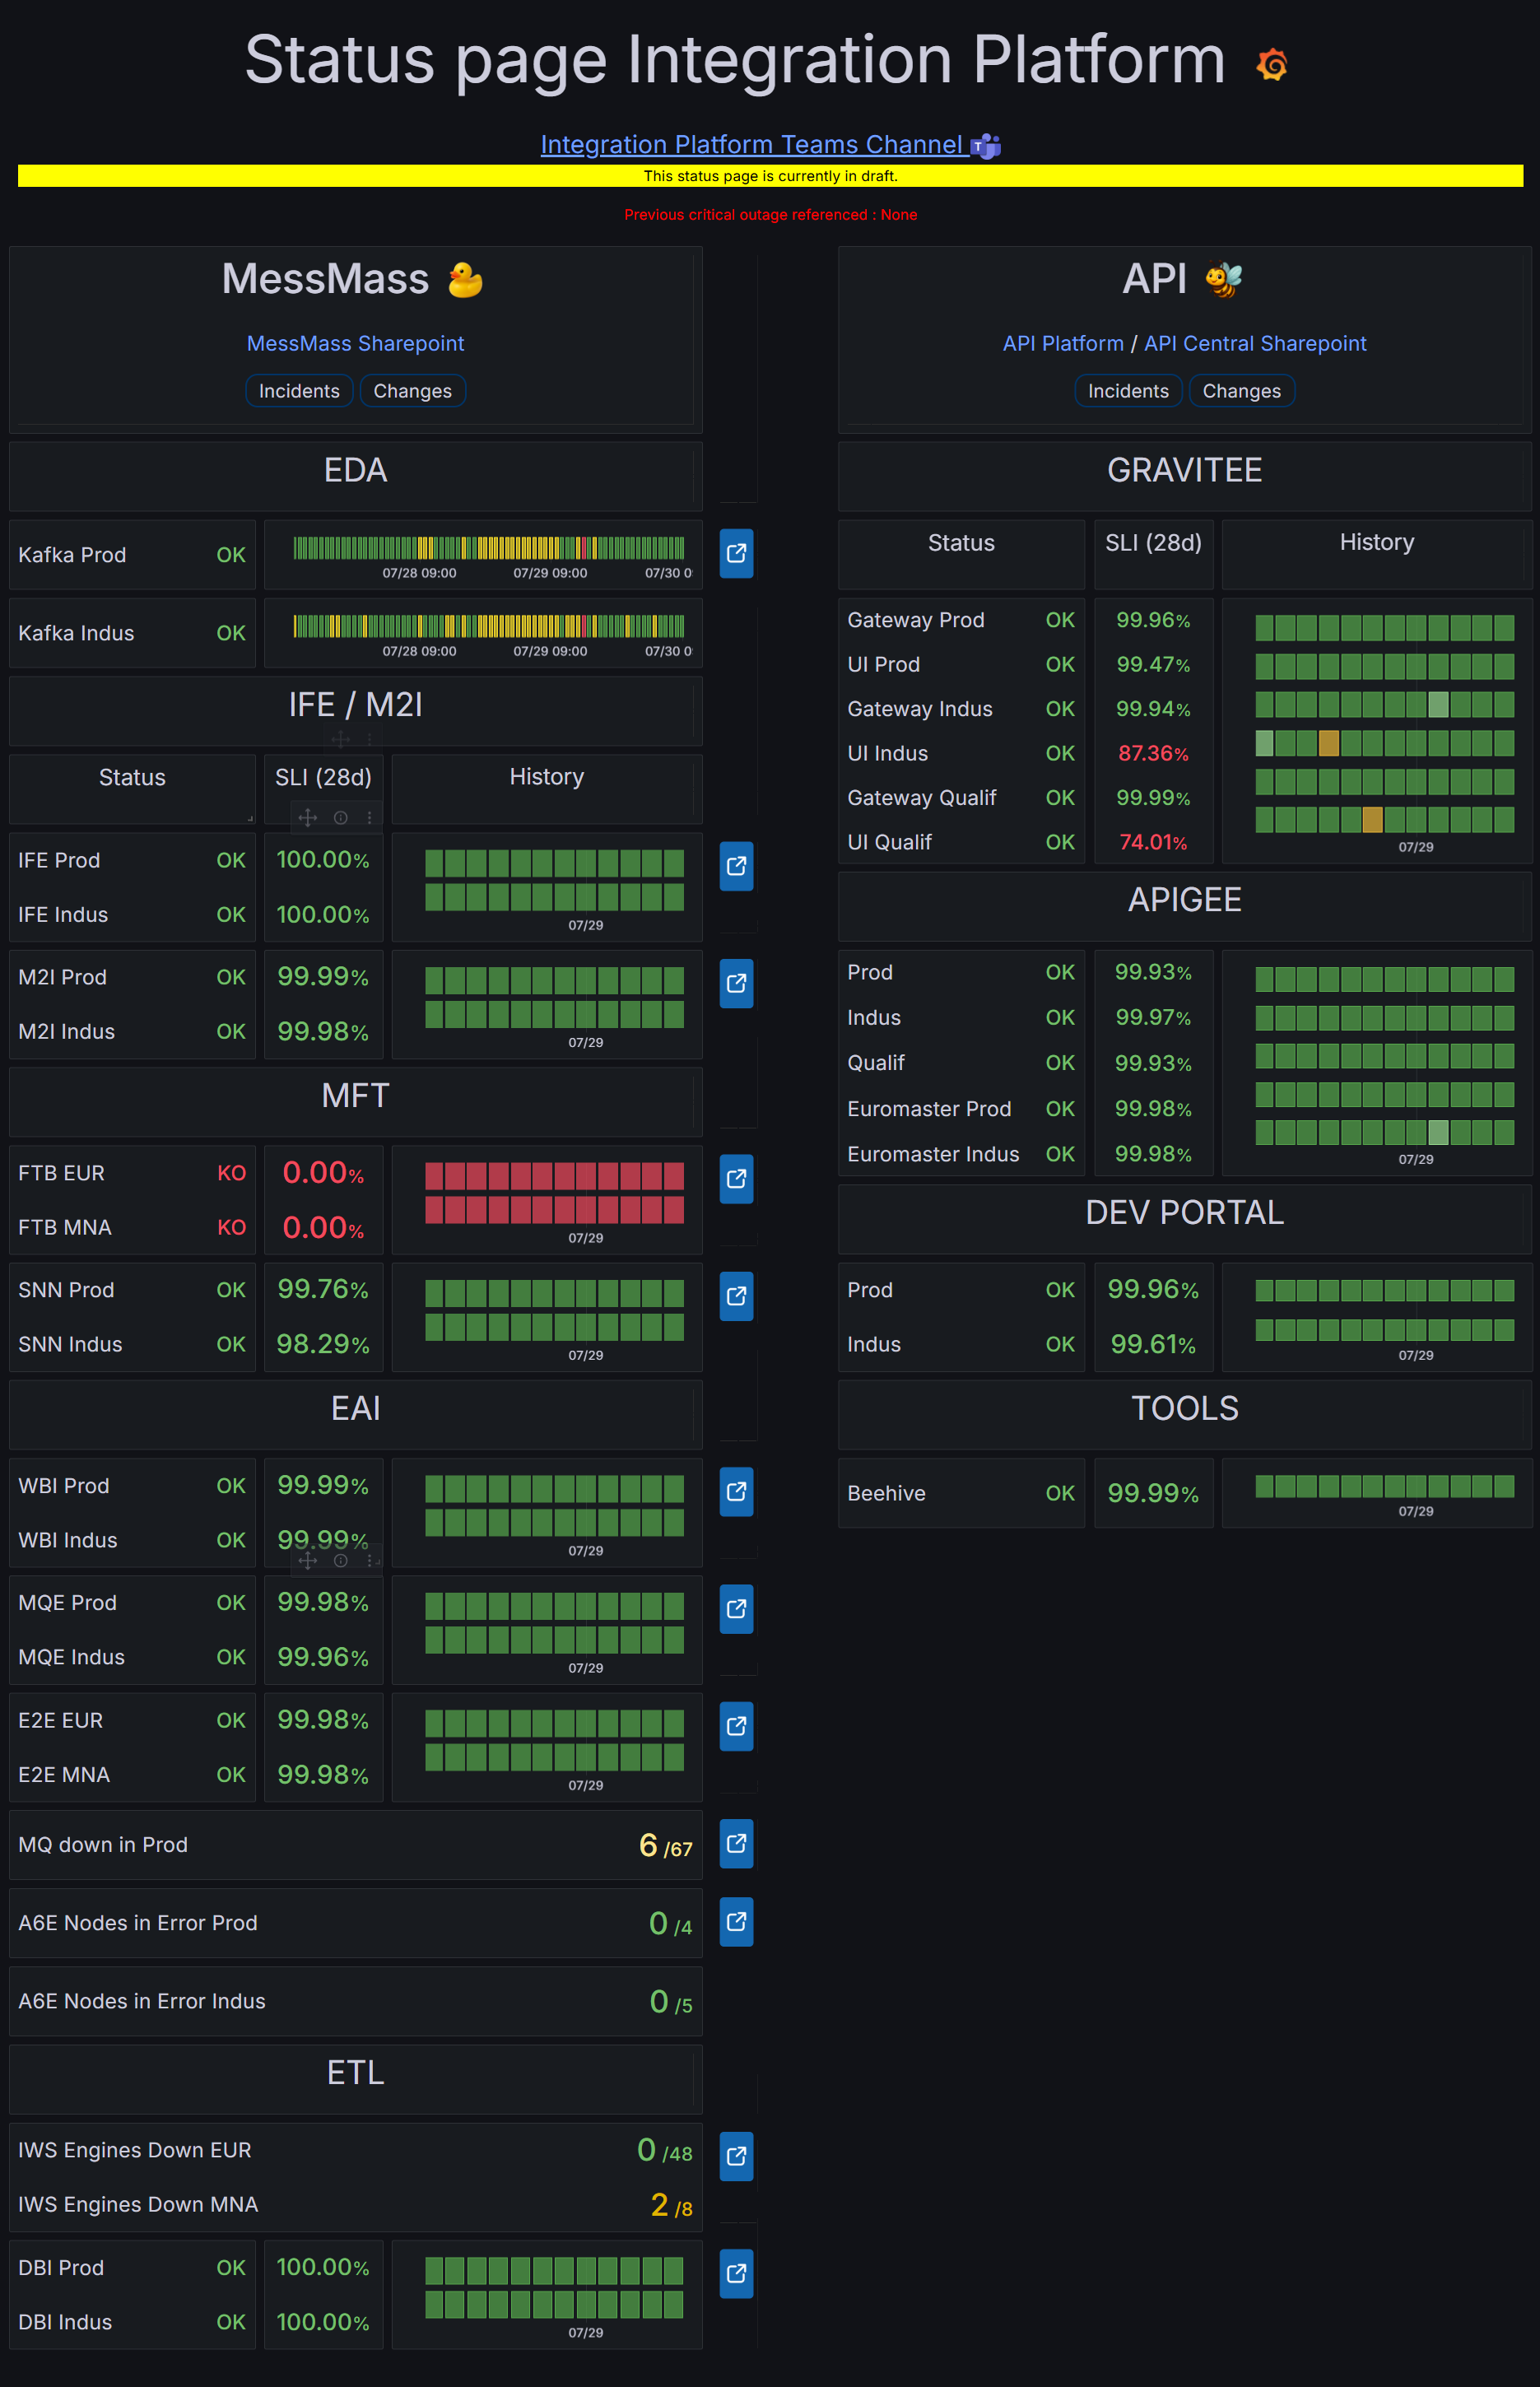
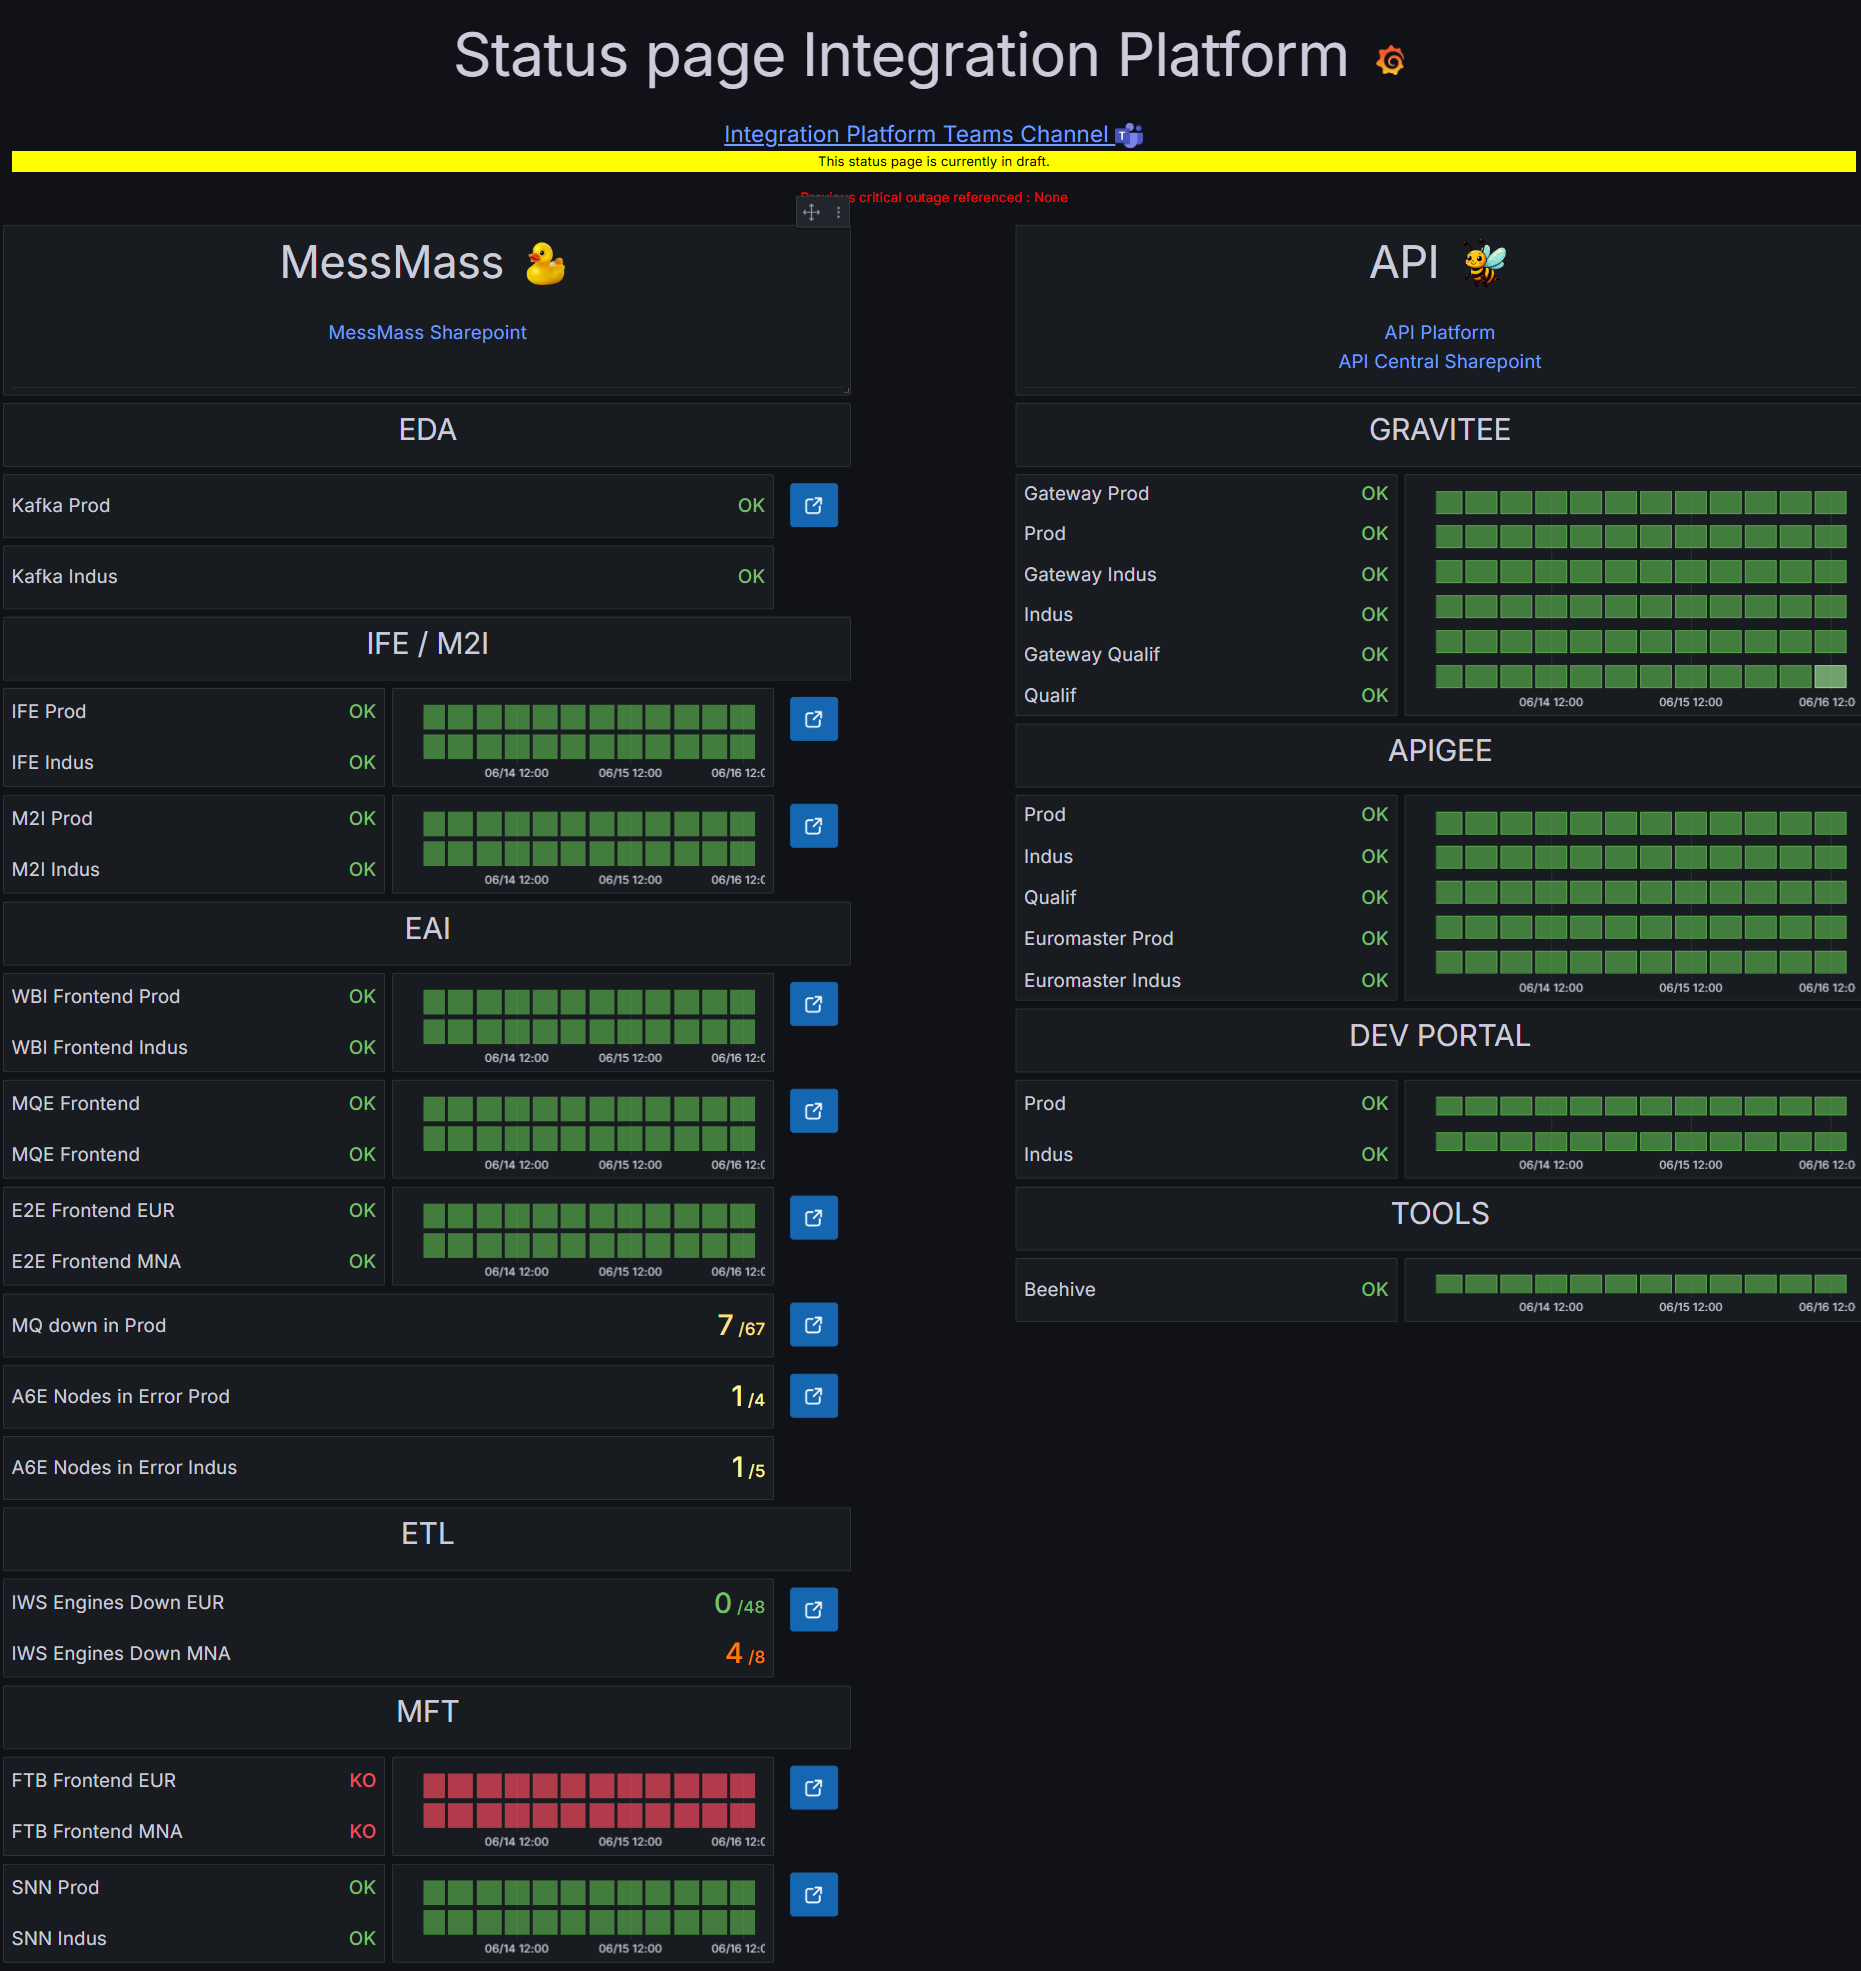
Final version
Version validated by the squad, presenting statuses, incident history,
SLI/SLO indicators, and an information banner for each functional
domain.
Concepts used
- Grafana for visualization and panel arrangement (Canvas, tables, cards).
- Prometheus and its exporters (Blackbox, OpenTelemetry) for metric collection and exposure.
- K6 for load testing and API response time evaluation.
- Python, Shell and REST API for data aggregation, transformation and exposure.
- Writing user and technical documentation, and creating a graphical charter and usage guidelines.